This lesson requires students to use textual and quantitative primary sources to construct a composite sketch of the free black community in Philadelphia during this period. They will also interpret and compile numeric data to create a population pyramid and answer essential questions about free blacks.
The Demography of Philadelphia’s Free Blacks Community
The Demography of Philadelphia’s Free Blacks Community
Essential Questions
What role does analysis have in historical construction?
Objectives
- Students will identify key population demographics of the free black community by inspecting and evaluating data from the Census of Colored People in Philadelphia.
- Students will analyze primary documents and make comparisons between statistical and textual evidence by examining the similarities and differences between the census data and John Willson’s description of the free black community.
- Students will use mathematics to analyze and make historical conclusions by developing a bar graph to represent sex and age data about the free black community in Philadelphia.
Primary Sources
Other Materials
Suggested Instructional Procedures
- Teachers can start this lesson by connecting it to the first lesson in this unit plan. Ask a student to provide a description of the free black community in Philadelphia based on Willson’s text.
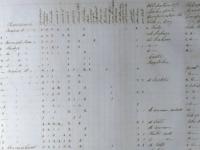
- The teacher should advise students that they will be examining the Census of Colored People in Philadelphia population data that will provide them with another perspective on free African Americans living in Philadelphia.
- Distribute copies of the census to students. Direct students to carefully study the schedules. After a few minutes, use the following questions in a classroom discussion.
- What kind of document are you studying?
- Who collected the information? Why?
- What are some interesting categories?
- Are there any parts of the document that are illegible or confusing?
- Explain to students that they are looking at data that was collected on African Americans in Philadelphia in 1847. Tell students that they will be working with similar data (from different volumes of the same census) but in an electronic format on a Web site. Note: The Pennsylvania Abolition Society's role in collecting the information should be highlighted in this portion of the lesson. This information can be found in the Legacies article and Richard S. Newman essay under Teacher Background materials.
- Distribute the handout on graphing to students. Discuss the information with the students. If necessary, review this concept with them. Advise students that their understanding of graphing is necessary for them to complete the next assignment.
- Hand out graphing paper and study a single page of the census to graph the data on age to form a bar graph and on sex to form another bar graph. Advise students to use the handout if they have trouble graphing the data.
- After the groups have completed their bar graphs, distribute the Census of Colored People in Philadelphia handout which asks students to answer some basic questions based on their bar graphs.
- Discuss students’ answers, giving them ample opportunity to relate their responses to the sex and age data.
Vocabulary
Census: an official count or survey of a population
Data: facts or statistics collected together for reference or analysis
Related Resources for Students

Plans in this Unit
Grade Level
Middle School
High School
Duration
One class period
Standards/Eligible Content
7.3.9.A
8.1.7.B
8.1.U.B
8.1.U.C
8.2.9.B
8.2.12.B
Attention Teachers!
Let us know how you used this plan and be featured on our site! Submit your story here.